
Market Cap vs FDV: What’s the Difference and Why It Matters
Quick Summary:
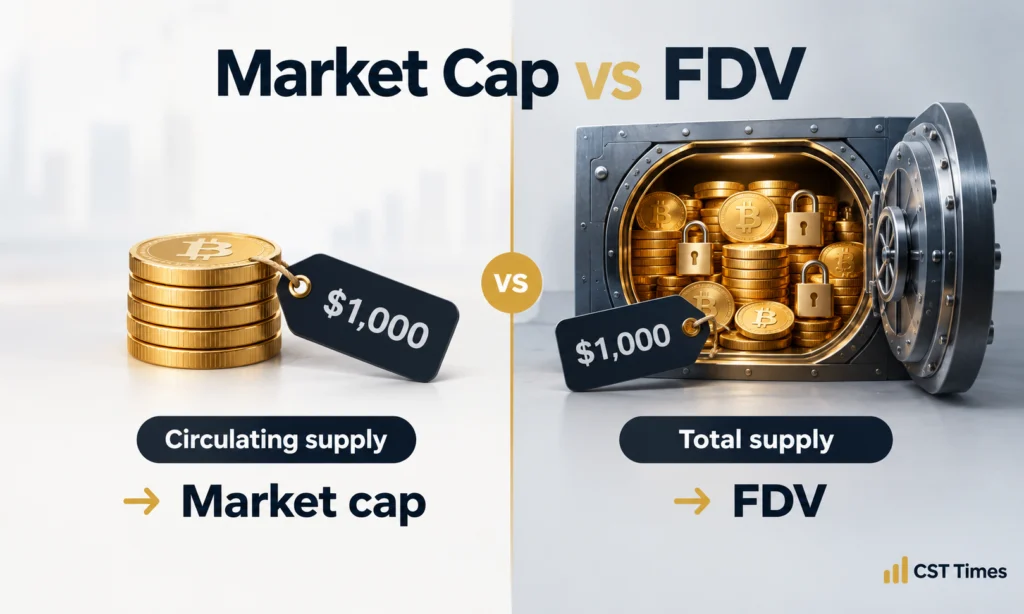
Market cap vs FDV is the comparison between what a crypto token’s trading supply is worth today and what its entire planned supply would be worth at the same price. Market cap multiplies the price by the coins already in circulation, while fully diluted valuation (FDV) multiplies that price by the full supply, including coins that are still locked or unreleased. This guide explains how each is calculated, why the gap between them matters, and five checks to run before you trust either number.
Table of Contents
ToggleKey Takeaways
- Market cap values only the tokens circulating today, while FDV values every token planned to exist.
- A wide gap between the two means much of the supply is still locked, which can add selling pressure when it unlocks.
- Binance Research estimated that about $155 billion of tokens would unlock between 2024 and 2030.
- FDV is a theoretical figure, not a price forecast, and platforms calculate it in different ways.
- The market cap to FDV ratio and the unlock schedule give the clearest picture together.
What is Market Cap in Crypto?
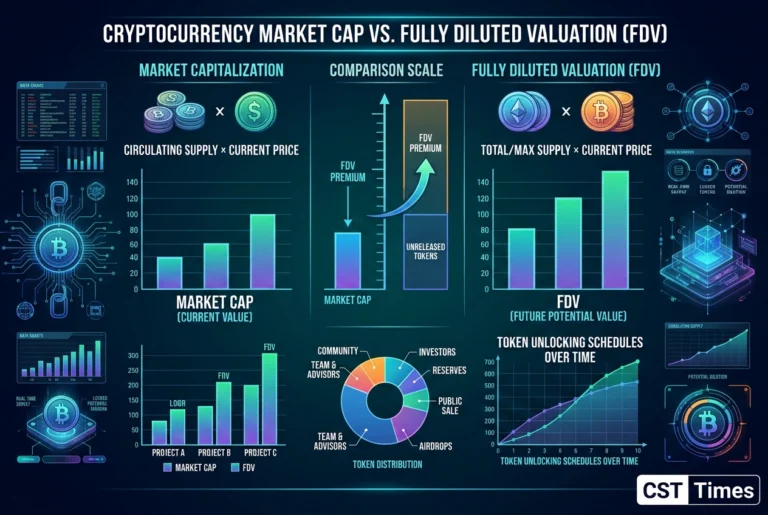
Market cap is the total value of a cryptocurrency’s circulating supply: the current price multiplied by the number of coins available to trade. CoinGecko compares it to the stock market’s approach of counting shares that are readily available, not those held and locked by insiders.
Formula: Market cap = current price × circulating supply
Because it only counts coins in circulation, market cap shows what the market is paying for today’s tradable supply.
What is FDV in Crypto?
FDV, or fully diluted valuation, is the theoretical market cap of a token if its entire supply were already in circulation at today’s price. CoinGecko calls it theoretical because releasing more supply can move the price, and lock-ups or emission schedules can mean full release takes a long time.
Formula: FDV = current price × total (or maximum) supply
Market Cap vs FDV: Side-by-Side Comparison
The main difference is the supply used. Market cap uses circulating supply, so it shows today’s tradable value. FDV uses total or maximum supply, so it shows the value if every token were released at the current price. The gap between the two shows how much supply is still to come.
| Market cap | FDV | |
|---|---|---|
| Supply used | Circulating supply | Total or maximum supply |
| What it shows | Value of tokens trading now | Value if all tokens were in circulation |
| Changes when | Price or circulating supply changes | Price changes, or supply is minted or burned |
| Best for | Judging a token’s current size | Judging future dilution risk |
| Main weakness | Can hide locked supply | Theoretical; assumes today’s price holds |
A Simple Example With Numbers
The figures below are hypothetical and do not describe any real token. Imagine two tokens, each priced at $2.00 with a total supply of 1 billion.
| Token A | Token B | |
|---|---|---|
| Price | $2.00 | $2.00 |
| Circulating supply | 100 million | 800 million |
| Market cap | $200 million | $1.6 billion |
| FDV | $2 billion | $2 billion |
| Market cap ÷ FDV | 0.10 | 0.80 |
In this market cap vs FDV example, both tokens have the same FDV, but Token A’s market cap is only a tenth of it. If all 1 billion Token A coins circulated and its market cap stayed at $200 million, each coin would be worth $0.20, which is 90% lower. To hold $2.00, buyers would have to lift its market cap tenfold to $2 billion. Token B faces a far smaller jump. Real prices depend on demand and timing, so this is an illustration, not a prediction.
Why the Gap Between Market Cap and FDV Matters
In any market cap vs FDV comparison, a wide gap usually means most tokens are still locked for team members, early investors, or ecosystem funds. When those tokens unlock, more supply can reach the market. If demand does not grow with it, the price can come under pressure.
Binance Research raised this concern in May 2024. As Cointelegraph reported, Binance said launches with small circulating supplies can rise quickly in bullish markets because liquidity is thin, but that growth is hard to sustain when a wave of unlocked supply arrives. It estimated about $155 billion in tokens would unlock from 2024 to 2030.
Recent data points the same way. Memento Research tracked 118 token launches in 2025 and found, as The Defiant reported, that more than 84% were trading below their launch valuations, with a median loss above 70% (data as of December 20, 2025). CryptoSlate’s summary adds that none of the 28 launches that started at $1 billion FDV or higher were in profit.
This shows a pattern, not a rule: CryptoSlate notes that Aster grew from a $675 million FDV to over $5 billion after launch, so supply structure is only one factor.
Why CoinGecko and CoinMarketCap Show Different FDV
Platforms use different supply figures. CoinGecko calculates FDV with total supply, while CoinMarketCap uses maximum supply, according to one industry guide. The same token can therefore show two different FDVs.
Here is what the three supply terms mean on CoinGecko:
- Circulating supply: coins publicly available to trade.
- Total supply: coins that exist on-chain, minus any that were burned.
- Max supply: the theoretical maximum, as set in the code.
Some tokens have no fixed cap. TradingView notes that coins without a published maximum supply, such as Dogecoin, get no fully diluted market cap on its platform. Check which supply figure a site uses before comparing FDV across projects.
How to Read the Market Cap to FDV Ratio
The market cap to FDV ratio puts the market cap vs FDV comparison into one number: market cap divided by FDV. A ratio near 1 means almost all supply already circulates, while a low ratio means much of it is still locked. CoinGecko displays the same idea in its Market Cap/FDV metric.
Bitcoin shows the high end. Its supply is capped at 21 million, and The Block reported in March 2026 that more than 95.2% had been mined, so its market cap and FDV sit close together. In our example, Token A’s 0.10 sits at the other extreme.
No official threshold separates a “good” ratio from a “bad” one. Treat a low ratio as a prompt to read the unlock schedule, not as a verdict.
5 Checks Before You Trust a Valuation
- Confirm the supply figure. Look at circulating, total, and max supply, and read the platform’s methodology note.
- Calculate the ratio. Divide market cap by FDV and compare it with similar projects.
- Read the unlock schedule. Note how many tokens unlock, when, and who receives them (team, early investors, community, or ecosystem funds). Trackers such as Tokenomist list upcoming unlocks.
- Compare unlocks with trading volume. A large unlock relative to daily volume is harder for the market to absorb.
- Ask what justifies the valuation. Look for real usage, users, or revenue. A high FDV with little adoption raises questions.
These checks improve how you read the numbers. They do not predict price.
Limits of Both Metrics
Market cap can look reassuring while hiding a large locked supply, and on thinly traded tokens a few large sales can move the price. FDV assumes today’s price holds and that every planned token is released, though supply schedules can change. Neither metric measures security, product quality, or real adoption.
Final Thoughts:
Market cap vs FDV is not a contest with one winner, because the two numbers answer different questions. Market cap shows what the market values today, while FDV shows how much supply could still arrive. Use both together, check the unlock schedule, and treat a large gap as a reason to research further rather than a prediction.
FAQs
What is the difference between market cap and FDV?
Market cap values a token using only its circulating supply, meaning the coins available to trade now. FDV uses the total or maximum supply, including locked and unreleased coins. Both multiply by the same current price, so the size of the gap depends on how much supply is still to be released.
Is a high FDV bad?
Not automatically. A high FDV compared with market cap signals that many tokens are still locked, which creates potential dilution when they unlock. It becomes a concern when adoption or demand is too low to absorb that new supply. Check the unlock schedule before judging.
Why is FDV usually higher than market cap?
FDV counts every planned token, while market cap counts only those in circulation. Many projects hold back supply for teams, investors, and ecosystem funds under vesting schedules. Until those tokens are released, FDV stays above market cap. The two only match when all supply is circulating.
Can FDV equal market cap?
Yes. If a token’s entire supply is already in circulation, market cap and FDV are the same number. Bitcoin is close to this point, with more than 95% of its 21 million cap already mined as of March 2026, so its two figures sit near each other.
Market cap vs FDV: which should I use?
Use both. In the market cap vs FDV debate, market cap shows the token’s current size, and FDV shows how large it could become on today’s price if all supply circulated. Comparing them through the market cap to FDV ratio, alongside the unlock schedule, gives a more complete picture than either number alone.
Does FDV predict a token’s future price?
No. FDV is a theoretical figure that assumes today’s price stays constant while all supply circulates. In reality, new supply, demand, market conditions, and project progress all affect price. FDV helps you assess dilution risk, but it cannot forecast where the price will go.
Disclaimer
This article is for educational and informational purposes only and is not financial, investment, or legal advice. Crypto assets are volatile, and you can lose some or all of your money. Always do your own research.
